The goal of this project is to present in the simplest possible way how the children, adolescents and some adults have been killed, attacked or injured by people, military groups, inefficiencies of some governmental organizations and so on. In a sense the idea is to let each of the organizations in charge of each of the different cases to improve and reduce this kind of problems that always affect people in need and the weakest links in our civilizations.
WHAT: Data: Multidimensional table: One quantitative value attribute, two categorical key attributes for the year and violence type.
WHAT: Derived: One quantitative attribute value to sort the view.
WHY: Present distribution of types of violence and deaths over a period of 4 years in Colombia. SEPARATE, ORDER and ALIGN
HOW: Encode: Line marks with length channel; rectilinear layout.
HOW: Manipulate: To show the type of cases of violence, category 1.
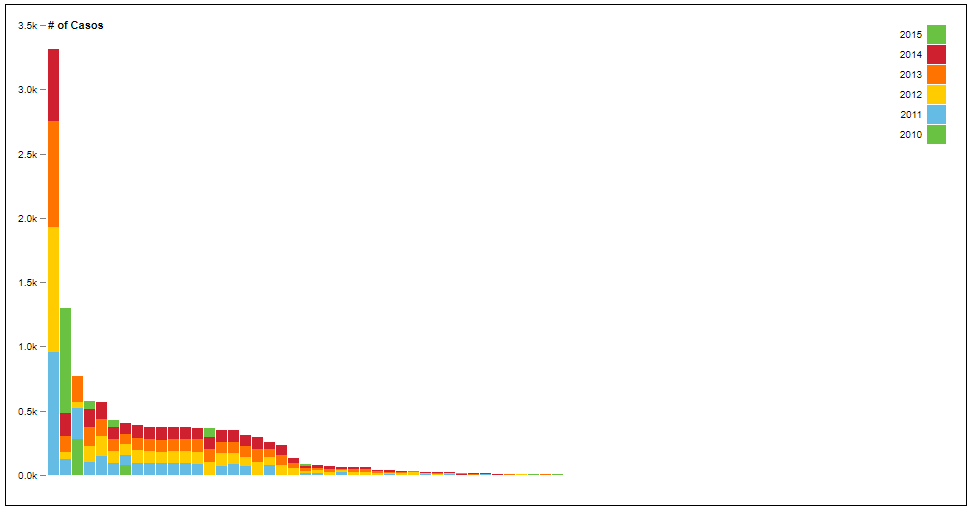
Marks:Lines in an ordered way to express the caterory related to the type of cases
Channels:Color for the categories related to years (aka category 2), lenght for the quantitative attribute of the number of cases
Insight:In is interesting that this dataset is about bacteria and how that affect children, but once the data is visualized it can be appreciated that there are more problems that affect Colombia, in fact the title for the dataset is not what the information have, at least not the bacteria alone, there are more bacteria apparently and it can be noticed that even the “conflicto armado” is causing violence cases in Colombia.